Knowledge
- Identify hot keys and fields used with resxtop/esxtop
- Identify fields used with vscsiStats
Skills and Abilities
- Configure esxtop/resxtop custom profiles
- Determine use cases for and apply esxtop/resxtop Interactive, Batch and Replay modes
- Use vscsiStats to gather storage performance data
- Use esxtop/resxtop to collect performance data
-
Given esxtop/resxtop output, identify relative performance data for capacity planning purposes
Configure esxtop/resxtop custom profiles
Official Documentation:
vSphere Monitoring and Performance Guide, Chapter 7 “Performance Monitoring Utilities: resxtop and esxtop”, page 45.
The resxtop and esxtop command-line utilities provide a detailed look at how ESXi uses resources in real time.
You can start either utility in one of three modes: interactive (default), batch, or replay.
The fundamental difference between resxtop and esxtop is that you can use resxtop remotely, whereas you can start esxtop only through the ESXi Shell of a local ESXi host.
Using the esxtop Utility
You can run the esxtop utility using the ESXi Shell to communicate with the ESXi host’s management interface.
You must have root user privileges.
Type the command, using the options you want:
esxtop [-] [h] [v] [b] [s] [a]
[R vm-support_dir_path] [d delay] [n iter]
The esxtop utility reads its default configuration from .esxtop50rc on the ESXi system. This configuration file consists of nine lines.
The first eight lines contain lowercase and uppercase letters to specify which fields appear in which order on the CPU, memory, storage adapter, storage device, virtual machine storage, network, interrupt, and CPU power panels. The letters correspond to the letters in the Fields or Order panels for the respective esxtop panel.
The ninth line contains information on the other options. Most important, if you saved a configuration in secure mode, you do not get an insecure esxtop without removing the s from the seventh line of your .esxtop50rc file. A number specifies the delay time between updates. As in interactive mode, typing c, m, d, u, v, n, I, or p determines the panel with which esxtop starts.
NOTE Do not edit the .esxtop50rc file. Instead, select the fields and the order in a running esxtop process, make changes, and save this file using the W interactive command.
Using the resxtop Utility
The resxtop utility is a vSphere CLI command.
Before you can use any vSphere CLI commands, you must either download and install a vSphere CLI package or deploy the vSphere Management Assistant (vMA) to your ESXi host or vCenter Server system.
After it is set up, start resxtop from the command line. For remote connections, you can connect to a host either directly or through vCenter Server.
The command-line options listed in the following table are the same as for esxtop (except for the R option) with additional connection options.
NOTE resxtop does not use all the options shared by other vSphere CLI commands.
resxtop Command-Line Options
| Option | Description |
| [server] | Name of the remote host to connect to (required). If connecting directly to theESXi host, use the name of that host. If your connection to the ESXi host is indirect
(that is, through vCenter Server), use the name of the vCenter Server system for this option. |
| [vihost] | If you connect indirectly (through vCenter Server), this option should contain thename of the ESXi host you connect to. If you connect directly to the host, this option
is not used. Note that the host name needs to be the same as what appears in the vSphere Client. |
| [portnumber] | Port number to connect to on the remote server. The default port is 443, and unlessthis is changed on the server, this option is not needed. |
| [username] | User name to be authenticated when connecting to the remote host. The remoteserver prompts you for a password. |
You can also use resxtop on a local ESXi host by omitting the server option on the command line. The command defaults to localhost.
Using esxtop or resxtop in Interactive Mode
By default, resxtop and esxtop run in interactive mode. Interactive mode displays statistics in different panels.
A help menu is available for each panel.
Interactive Mode Command-Line Options
You can use various command-line options with esxtop and resxtop in interactive mode.
Interactive Mode Command-Line Options
| Option | Description |
| h | Prints help for resxtop (or esxtop) command-line options. |
| v | Prints resxtop (or esxtop) version number. |
| s | Calls resxtop (or esxtop) in secure mode. In secure mode, the -d command, which specifiesdelay between updates, is disabled. |
| d | Specifies the delay between updates. The default is five seconds. The minimum is two seconds.Change this with the interactive command s. If you specify a delay of less than two seconds,
the delay is set to two seconds. |
| n | Number of iterations. Updates the display n times and exits. Default value is 10000. |
| server | The name of the remote server host to connect to (required for resxtop only). |
| vihost | If you connect indirectly (through vCenter Server), this option should contain the name of theESXi host you connect to. If you connect directly to the ESXi host, this option is not used. Note
that the host name needs to be the same as what is displayed in the vSphere Client. |
| portnumber | The port number to connect to on the remote server. The default port is 443, and unless this ischanged on the server, this option is not needed. (resxtop only) |
| username | The user name to be authenticated when connecting to the remote host. The remote serverprompts you for a password, as well (resxtop only). |
| a | Show all statistics. This option overrides configuration file setups and shows all statistics. Theconfiguration file can be the default ~/.esxtop50rc configuration file or a user-defined
configuration file. |
| c filename | Load a user-defined configuration file. If the -c option is not used, the default configurationfilename is ~/.esxtop50rc. Create your own configuration file, specifying a different filename,
using the W single-key interactive command. |
Common Statistics Description
Several statistics appear on the different panels while resxtop (or esxtop) is running in interactive mode. These statistics are common across all four panels.
The Uptime line, found at the top of each of the four resxtop (or esxtop) panels, displays the current time, time since last reboot, number of currently running worlds and load averages. A world is an ESXi Vmkernel schedulable entity, similar to a process or thread in other operating systems.
Below that the load averages over the past one, five, and fifteen minutes appear. Load averages take into account both running and ready-to-run worlds. A load average of 1.00 means that there is full utilization of all physical CPUs. A load average of 2.00 means that the ESXi system might need twice as many physical CPUs as are currently available. Similarly, a load average of 0.50 means that the physical CPUs on the ESXi system are half utilized.
Statistics Columns and Order Pages
You can define the order of fields displayed in interactive mode.
If you press f, F, o, or O, the system displays a page that specifies the field order on the top line and short descriptions of the field contents. If the letter in the field string corresponding to a field is uppercase, the field is displayed. An asterisk in front of the field description indicates whether a field is displayed.
The order of the fields corresponds to the order of the letters in the string.
From the Field Select panel, you can:
- Toggle the display of a field by pressing the corresponding letter.
- Move a field to the left by pressing the corresponding uppercase letter.
- Move a field to the right by pressing the corresponding lowercase letter.
Interactive Mode Single-Key Commands
When running in interactive mode, resxtop (or esxtop) recognizes several single-key commands.
All interactive mode panels recognize the commands listed in the following table. The command to specify the delay between updates is disabled if the s option is given on the command line. All sorting interactive commands sort in descending order.
Interactive Mode Single-Key Commands
| Key | Description |
| h or ? | Displays a help menu for the current panel, giving a brief summary of commands, and the status of secure mode. |
| Space | Immediately updates the current panel. |
| ^L | Erases and redraws the current panel. |
| f or F | Displays a panel for adding or removing statistics columns (fields) to or from the current panel. |
| o or O | Displays a panel for changing the order of statistics columns on the current panel. |
| # | Prompts you for the number of statistics rows to display. Any value greater than 0 overrides automaticdetermination of the number of rows to show, which is based on window size measurement. If you change this
number in one resxtop (or esxtop) panel, the change affects all four panels. |
| s | Prompts you for the delay between updates, in seconds. Fractional values are recognized down to microseconds.The default value is five seconds. The minimum value is two seconds. This command is not available in secure
mode. |
| W | Write the current setup to an esxtop (or resxtop) configuration file. This is the recommended way to write aconfiguration file. The default filename is the one specified by -c option, or ~/.esxtop50rc if the -c option is not
used. You can also specify a different filename on the prompt generated by this W command. |
| q | Quit interactive mode. |
| c | Switch to the CPU resource utilization panel. |
| p | Switch to the CPU Power utilization panel. |
| m | Switch to the memory resource utilization panel. |
| d | Switch to the storage (disk) adapter resource utilization panel. |
| u | Switch to storage (disk) device resource utilization screen. |
| v | Switch to storage (disk) virtual machine resource utilization screen. |
| n | Switch to the network resource utilization panel. |
| i | Switch to the interrupt panel. |
CPU Panel
The CPU panel displays server-wide statistics as well as statistics for individual world, resource pool, and virtual machine CPU utilization.
Resource pools, virtual machines that are running, or other worlds are at times called groups. For worlds belonging to a virtual machine, statistics for the virtual machine that is running are displayed. All other worlds are logically aggregated into the resource pools that contain them.
CPU Panel Statistics
| Line | Description |
| PCPU USED(%) | A PCPU refers to a physical hardware execution context. This can be a physical CPU core ifhyperthreading is unavailable or disabled, or a logical CPU (LCPU or SMT thread) if hyperthreading
is enabled. PCPU USED(%) displays the following percentages:
CPU Usage (%USED) is the percentage of PCPU nominal frequency that was used since the last screen update. It equals the total sum of %USED for Worlds that ran on this PCPU. NOTE If a PCPU is running at frequency that is higher than its nominal (rated) frequency, then PCPU USED(%) can be greater than 100%. If a PCPU and its partner are busy when hyperthreading is enabled, each PCPU accounts for half of the CPU usage. |
| PCPU UTIL(%) | A PCPU refers to a physical hardware execution context. This can be a physical CPU core ifhyperthreading is unavailable or disabled, or a logical CPU (LCPU or SMT thread) if hyperthreading
is enabled. PCPU UTIL(%) represents the percentage of real time that the PCPU was not idle (raw PCPU utilization) and it displays the percentage CPU utilization per PCPU, and the percentage CPU utilization averaged over all PCPUs. NOTE PCPU UTIL(%) might differ from PCPU USED(%) due to power management technologies or hyperthreading. |
| ID | Resource pool ID or virtual machine ID of the resource pool or virtual machine of the world that isrunning, or world ID of the world that is running. |
| GID | Resource pool ID of the resource pool or virtual machine of the world that is running. |
| NAME | Name of the resource pool or virtual machine of the world that is running, or name of the world thatis running. |
| NWLD | Number of members in the resource pool or virtual machine of the world that is running. If a Groupis expanded using the interactive command e, then NWLD for all the resulting worlds is 1. |
| %STATE TIMES | Set of CPU statistics made up of the following percentages. For a world, the percentages are apercentage of one physical CPU core. |
| %USED | Percentage of physical CPU core cycles used by the resource pool, virtual machine, or world. %USEDmight depend on the frequency with which the CPU core is running. When running with lower CPU
core frequency, %USED can be smaller than %RUN. On CPUs which support turbo mode, CPU frequency can also be higher than the nominal (rated) frequency, and %USED can be larger than %RUN. |
| %SYS | Percentage of time spent in the ESXi VMkernel on behalf of the resource pool, virtual machine, orworld to process interrupts and to perform other system activities. This time is part of the time used
to calculate %USED. |
| %WAIT | Percentage of time the resource pool, virtual machine, or world spent in the blocked or busy waitstate. This percentage includes the percentage of time the resource pool, virtual machine, or world
was idle. |
| %VMWAIT | The total percentage of time the Resource Pool/World spent in a blocked state waiting for events. |
| %IDLE | Percentage of time the resource pool, virtual machine, or world was idle. Subtract this percentagefrom %WAIT to see the percentage of time the resource pool, virtual machine, or world was waiting
for some event. The difference, %WAIT- %IDLE, of the VCPU worlds can be used to estimate guest I/O wait time. To find the VCPU worlds, use the single-key command e to expand a virtual machine and search for the world NAME starting with “vcpu”. (The VCPU worlds might wait for other events in addition to I/O events, so this measurement is only an estimate.) |
| %RDY | Percentage of time the resource pool, virtual machine, or world was ready to run, but was notprovided CPU resources on which to execute. |
| %MLMTD (maxlimited) | Percentage of time the ESXi VMkernel deliberately did not run the resource pool, virtual machine,or world because doing so would violate the resource pool, virtual machine, or world’s limit setting.
Because the resource pool, virtual machine, or world is ready to run when it is prevented from running in this way, the %MLMTD (max limited) time is included in %RDY time. |
| %SWPWT | Percentage of time a resource pool or world spends waiting for the ESXi VMkernel to swap memory.The %SWPWT (swap wait) time is included in the %WAIT time. |
| EVENT COUNTS/s | Set of CPU statistics made up of per second event rates. These statistics are for VMware internal useonly. |
| CPU ALLOC | Set of CPU statistics made up of the following CPU allocation configuration parameters. |
| AMIN | Resource pool, virtual machine, or world attribute Reservation. |
| AMAX | Resource pool, virtual machine, or world attribute Limit. A value of -1 means unlimited. |
| ASHRS | Resource pool, virtual machine, or world attribute Shares. |
| SUMMARY STATS | Set of CPU statistics made up of the following CPU configuration parameters and statistics. Thesestatistics apply only to worlds and not to virtual machines or resource pools. |
| AFFINITY BITMASK | Bit mask showing the current scheduling affinity for the world. |
| HTSHARING | Current hyperthreading configuration. |
| CPU | The physical or logical processor on which the world was running when resxtop (or esxtop)obtained this information. |
| HTQ | Indicates whether the world is currently quarantined or not. N means no and Y means yes. |
| TIMER/s | Timer rate for this world. |
| %OVRLP | Percentage of system time spent during scheduling of a resource pool, virtual machine, or world onbehalf of a different resource pool, virtual machine, or world while the resource pool, virtual
machine, or world was scheduled. This time is not included in %SYS. For example, if virtual machine A is currently being scheduled and a network packet for virtual machine B is processed by the ESXi VMkernel, the time spent appears as %OVRLP for virtual machine A and %SYS for virtual machine B. |
| %RUN | Percentage of total time scheduled. This time does not account for hyperthreading and system time.On a hyperthreading enabled server, the %RUN can be twice as large as %USED. |
| %CSTP | Percentage of time a resource pool spends in a ready, co-deschedule state.NOTE You might see this statistic displayed, but it is intended for VMware use only. |
| POWER | Current CPU power consumption for a resource pool (in Watts). |
| %LAT_C | Percentage of time the resource pool or world was ready to run but was not scheduled to run becauseof CPU resource contention. |
| %LAT_M | Percentage of time the resource pool or world was ready to run but was not scheduled to run becauseof memory resource contention. |
| %DMD | CPU demand in percentage. It represents the average active CPU load in the past minute. |
You can change the display using single-key commands.
CPU Panel Single-Key Commands
| Command | Description |
| e | Toggles whether CPU statistics are displayed expanded or unexpanded.The expanded display includes CPU resource utilization statistics broken down by individual worlds
belonging to a resource pool or virtual machine. All percentages for the individual worlds are percentage of a single physical CPU. Consider these examples:
|
| U | Sorts resource pools, virtual machines, and worlds by the resource pool’s or virtual machine’s %Usedcolumn. This is the default sort order. |
| R | Sorts resource pools, virtual machines, and worlds by the resource pool’s or virtual machine’s %RDYcolumn. |
| N | Sorts resource pools, virtual machines, and worlds by the GID column. |
| V | Displays virtual machine instances only. |
| L | Changes the displayed length of the NAME column. |
CPU Power Panel
The CPU Power panel displays CPU Power utilization statistics.
On the CPU Power panel, statistics are arranged per PCPU. A PCPU is a physical hardware execution context — a physical CPU core if hyper-threading is unavailable or disabled, or a logical CPU (LCPU or SMT thread) if hyper-threading is enabled.
CPU Power Panel Statistics
| Line | Description |
| Power Usage | Current total power usage (in Watts). |
| Power Cap | Total power cap (in Watts). |
| PSTATE MHZ | Clock frequence per state. |
| %USED | Percentage of PCPU nominal frequency used since the last screen update. It is the same as PCPUUSED(%) shown in the CPU Screen. |
| %UTIL | Raw PCPU utilization, that is the percentage of real time that PCPU was not idle. It is the same asPCPU UTIL(%) shown in the CPU Screen. |
| %Cx | Percentage of time the PCPU spent in C-State ‘x’. |
| %Px | Percentage of time the PCPU spent in P-State ‘x’. |
| %Tx | Percentage of time the PCPU spent in T-State ‘x’. |
Memory Panel
The Memory panel displays server-wide and group memory utilization statistics. As on the CPU panel, groups correspond to resource pools, running virtual machines, or other worlds that are consuming memory.
The first line, found at the top of the Memory panel displays the current time, time since last reboot, number of currently running worlds, and memory overcommitment averages. The memory overcommitment averages over the past one, five, and fifteen minutes appear. Memory overcommitment of 1.00 means a memory overcommitment of 100 percent.
Memory Panel Statistics
| Field | Description |
| PMEM (MB) | Displays the machine memory statistics for the server. All numbers are in megabytes.total Total amount of machine memory in the server.
vmk Amount of machine memory being used by the ESXi VMkernel. other Amount of machine memory being used by everything other than the ESXi VMkernel. free Amount of machine memory that is free. |
| VMKMEM (MB) | Displays the machine memory statistics for the ESXi VMkernel. All numbers are in megabytes.managed Total amount of machine memory managed by the ESXi
VMkernel. min free Minimum amount of machine memory that the ESXi VMkernel aims to keep free. rsvd Total amount of machine memory currently reserved by resource pools. ursvd Total amount of machine memory currently unreserved. state Current machine memory availability state. Possible values are high, soft, hard and low. High means that the machine memory is not under any pressure and low means that it is. |
| NUMA (MB) | Displays the ESXi NUMA statistics. This line appears only if the ESXi host is running on aNUMA server. All numbers are in megabytes.
For each NUMA node in the server, two statistics are displayed:
|
| PSHARE (MB) | Displays the ESXi page-sharing statistics. All numbers are in megabytes.shared Amount of physical memory that is being shared.
common Amount of machine memory that is common across worlds. saving Amount of machine memory that is saved because of page sharing. |
| SWAP (MB) | Displays the ESXi swap usage statistics. All numbers are in megabytes.curr Current swap usage.
rclmtgt Where the ESXi system expects the reclaimed memory to be. Memory can be reclaimed by swapping or compression. r/s Rate at which memory is swapped in by the ESXi system from disk. w/s Rate at which memory is swapped to disk by the ESXi system. |
| ZIP (MB) | Displays the ESXi memory compression statistics. All numbers are in megabytes.zipped Total compressed physical memory.
saved Saved memory by compression. |
| MEMCTL (MB) | Displays the memory balloon statistics. All numbers are in megabytes.curr Total amount of physical memory reclaimed using the
vmmemctl module. target Total amount of physical memory the ESXi host attempts to reclaim using the vmmemctl module. max Maximum amount of physical memory the ESXi host can reclaim using the vmmemctl module. |
| AMIN | Memory reservation for this resource pool or virtual machine. |
| AMAX | Memory limit for this resource pool or virtual machine. A value of -1 means Unlimited. |
| ASHRS | Memory shares for this resource pool or virtual machine. |
| NHN | Current home node for the resource pool or virtual machine. This statistic is applicable onlyon NUMA systems. If the virtual machine has no home node, a dash (-) appears. |
| NRMEM (MB) | Current amount of remote memory allocated to the virtual machine or resource pool. Thisstatistic is applicable only on NUMA systems. |
| N% L | Current percentage of memory allocated to the virtual machine or resource pool that is local. |
| MEMSZ (MB) | Amount of physical memory allocated to a resource pool or virtual machine. |
| GRANT (MB) | Amount of guest physical memory mapped to a resource pool or virtual machine. Theconsumed host machine memory is equal to GRANT – SHRDSVD. |
| SZTGT (MB) | Amount of machine memory the ESXi VMkernel wants to allocate to a resource pool or virtualmachine. |
| TCHD (MB) | Working set estimate for the resource pool or virtual machine. |
| %ACTV | Percentage of guest physical memory that is being referenced by the guest. This is aninstantaneous value. |
| %ACTVS | Percentage of guest physical memory that is being referenced by the guest. This is a slowmoving average. |
| %ACTVF | Percentage of guest physical memory that is being referenced by the guest. This is a fastmoving average. |
| %ACTVN | Percentage of guest physical memory that is being referenced by the guest. This is anestimation. (You might see this statistic displayed, but it is intended for VMware use only.) |
| MCTL? | Memory balloon driver is installed or not. N means no, Y means yes. |
| MCTLSZ (MB) | Amount of physical memory reclaimed from the resource pool by way of ballooning. |
| MCTLTGT (MB) | Amount of physical memory the ESXi system attempts to reclaim from the resource pool orvirtual machine by way of ballooning. |
| MCTLMAX (MB) | Maximum amount of physical memory the ESXi system can reclaim from the resource poolor virtual machine by way of ballooning. This maximum depends on the guest operating
system type. |
| SWCUR (MB) | Current swap usage by this resource pool or virtual machine. |
| SWTGT (MB) | Target where the ESXi host expects the swap usage by the resource pool or virtual machineto be. |
| SWR/s (MB) | Rate at which the ESXi host swaps in memory from disk for the resource pool or virtualmachine. |
| SWW/s (MB) | Rate at which the ESXi host swaps resource pool or virtual machine memory to disk. |
| LLSWR/s (MB) | Rate at which memory is read from the host cache. |
| LLSWW/s (MB) | Rate at which memory is written to the host cache from various sources. |
| CPTRD (MB) | Amount of data read from checkpoint file. |
| CPTTGT (MB) | Size of checkpoint file. |
| ZERO (MB) | Resource pool or virtual machine physical pages that are zeroed. |
| SHRD (MB) | Resource pool or virtual machine physical pages that are shared. |
| SHRDSVD (MB) | Machine pages that are saved because of resource pool or virtual machine shared pages. |
| OVHD (MB) | Current space overhead for resource pool. |
| OVHDMAX (MB) | Maximum space overhead that might be incurred by resource pool or virtual machine. |
| OVHDUW (MB) | Current space overhead for a user world. (You might see this statistic displayed, but it isintended for VMware use only.) |
| GST_NDx (MB) | Guest memory allocated for a resource pool on NUMA node x. This statistic is applicable onNUMA systems only. |
| OVD_NDx (MB) | VMM overhead memory allocated for a resource pool on NUMA node x. This statistic isapplicable on NUMA systems only. |
| TCHD_W (MB) | Write working set estimate for resource pool. |
| CACHESZ (MB) | Compression memory cache size. |
| CACHEUSD (MB) | Used compression memory cache. |
| ZIP/s (MB/s) | Compressed memory per second. |
| UNZIP/s (MB/s) | Decompressed memory per second. |
Memory Panel Interactive Commands
| Command | Description |
| M | Sort resource pools or virtual machines by MEMSZ column. This is the default sort order. |
| B | Sort resource pools or virtual machines by Group Memctl column. |
| N | Sort resource pools or virtual machines by GID column. |
| V | Display virtual machine instances only. |
| L | Changes the displayed length of the NAME column. |
Storage Adapter Panel
Statistics in the Storage Adapter panel are aggregated per storage adapter by default. Statistics can also be viewed per storage path.
Storage Adapter Panel Statistics
| Column | Description |
| ADAPTR | Name of the storage adapter. |
| PATH | Storage path name. This name is only visible if the corresponding adapter is expanded. |
| NPTH | Number of paths. |
| AQLEN | Current queue depth of the storage adapter. |
| CMDS/s | Number of commands issued per second. |
| READS/s | Number of read commands issued per second. |
| WRITES/s | Number of write commands issued per second. |
| MBREAD/s | Megabytes read per second. |
| MBWRTN/s | Megabytes written per second. |
| RESV/s | Number of SCSI reservations per second. |
| CONS/s | Number of SCSI reservation conflicts per second. |
| DAVG/cmd | Average device latency per command, in milliseconds. |
| KAVG/cmd | Average ESXi VMkernel latency per command, in milliseconds. |
| GAVG/cmd | Average virtual machine operating system latency per command, in milliseconds. |
| QAVG/cmd | Average queue latency per command, in milliseconds. |
| DAVG/rd | Average device read latency per read operation, in milliseconds. |
| KAVG/rd | Average ESXi VMkernel read latency per read operation, in milliseconds. |
| GAVG/rd | Average guest operating system read latency per read operation, in milliseconds. |
| QAVG/rd | Average queue latency per read operation, in milliseconds. |
| DAVG/wr | Average device write latency per write operation, in milliseconds. |
| KAVG/wr | Average ESXi VMkernel write latency per write operation, in milliseconds. |
| GAVG/wr | Average guest operating system write latency per write operation, in milliseconds. |
| QAVG/wr | Average queue latency per write operation, in milliseconds. |
| FCMDS/s | Number of failed commands issued per second. |
| FREAD/s | Number of failed read commands issued per second. |
| FWRITE/s | Number of failed write commands issued per second. |
| FMBRD/s | Megabytes of failed read operations per second. |
| FMBWR/s | Megabytes of failed write operations per second. |
| FRESV/s | Number of failed SCSI reservations per second. |
| ABRTS/s | Number of commands aborted per second. |
| RESETS/s | Number of commands reset per second. |
| PAECMD/s | The number of PAE (Physical Address Extension) commands per second. |
| PAECP/s | The number of PAE copies per second. |
| SPLTCMD/s | The number of split commands per second. |
| SPLTCP/s | The number of split copies per second. |
The following table displays the interactive commands you can use with the storage adapter panel.
Storage Adapter Panel Interactive Commands
| Command | Description |
| e | Toggles whether storage adapter statistics appear expanded or unexpanded. Allows you to viewstorage resource utilization statistics broken down by individual paths belonging to an expanded
storage adapter. You are prompted for the adapter name. |
| r | Sorts by READS/s column. |
| w | Sorts by WRITES/s column. |
| R | Sorts by MBREAD/s read column. |
| T | Sorts by MBWRTN/s written column. |
| N | Sorts first by ADAPTR column, then by PATH column. This is the default sort order. |
Storage Device Panel
The storage device panel displays server-wide storage utilization statistics.
By default, the information is grouped per storage device. You can also group the statistics per path, per world, or per partition.
Storage Device Panel Statistics
| Column | Description |
| DEVICE | Name of the storage device. |
| PATH | Path name. This name is visible only if the corresponding device is expanded to paths. |
| WORLD | World ID. This ID is visible only if the corresponding device is expanded to worlds. |
| PARTITION | Partition ID. This ID is visible only if the corresponding device is expanded to partitions. |
| NPH | Number of paths. |
| NWD | Number of worlds. |
| NPN | Number of partitions. |
| SHARES | Number of shares. This statistic is applicable only to worlds. |
| BLKSZ | Block size in bytes. |
| NUMBLKS | Number of blocks of the device. |
| DQLEN | Current device queue depth of the storage device. |
| WQLEN | World queue depth. This is the maximum number of ESXi VMkernel active commands that the worldis allowed to have. This is a per device maximum for the world. It is valid only if the corresponding
device is expanded to worlds. |
| ACTV | Number of commands in the ESXi VMkernel that are currently active. This statistic applies to onlyworlds and devices. |
| QUED | Number of commands in the ESXi VMkernel that are currently queued. This statistic applies to onlyworlds and devices. |
| %USD | Percentage of the queue depth used by ESXi VMkernel active commands. This statistic applies to onlyworlds and devices. |
| LOAD | Ratio of ESXi VMkernel active commands plus ESXi VMkernel queued commands to queue depth. Thisstatistic applies to only worlds and devices. |
| CMDS/s | Number of commands issued per second. |
| READS/s | Number of read commands issued per second. |
| WRITES/s | Number of write commands issued per second. |
| MBREAD/s | Megabytes read per second. |
| MBWRTN/s | Megabytes written per second. |
| DAVG/cmd | Average device latency per command in milliseconds. |
| KAVG/cmd | Average ESXi VMkernel latency per command in milliseconds. |
| GAVG/cmd | Average guest operating system latency per command in milliseconds. |
| QAVG/cmd | Average queue latency per command in milliseconds. |
| DAVG/rd | Average device read latency per read operation in milliseconds. |
| KAVG/rd | Average ESXi VMkernel read latency per read operation in milliseconds. |
| GAVG/rd | Average guest operating system read latency per read operation in milliseconds. |
| QAVG/rd | Average queue read latency per read operation in milliseconds. |
| DAVG/wr | Average device write latency per write operation in milliseconds. |
| KAVG/wr | Average ESXi VMkernel write latency per write operation in milliseconds. |
| GAVG/wr | Average guest operating system write latency per write operation in milliseconds. |
| QAVG/wr | Average queue write latency per write operation in milliseconds. |
| ABRTS/s | Number of commands aborted per second. |
| RESETS/s | Number of commands reset per second. |
| PAECMD/s | Number of PAE commands per second. This statistic applies to only paths. |
| PAECP/s | Number of PAE copies per second. This statistic applies to only paths. |
| SPLTCMD/s | Number of split commands per second. This statistic applies to only paths. |
| SPLTCP/s | Number of split copies per second. This statistic applies to only paths. |
The following table displays the interactive commands you can use with the storage device panel.
Storage Device Panel Interactive Commands
| Command | Description |
| e | Expand or roll up storage world statistics. This command allows you to view storage resource utilizationstatistics separated by individual worlds belonging to an expanded storage device. You are prompted
for the device name. The statistics are per world per device. |
| P | Expand or roll up storage path statistics. This command allows you to view storage resource utilizationstatistics separated by individual paths belonging to an expanded storage device. You are prompted for
the device name. |
| t | Expand or roll up storage partition statistics. This command allows you to view storage resourceutilization statistics separated by individual partitions belonging to an expanded storage device. You
are prompted for the device name. |
| r | Sort by READS/s column. |
| w | Sort by WRITES/s column. |
| R | Sort by MBREAD/s column. |
| T | Sort by MBWRTN column. |
| N | Sort first by DEVICE column, then by PATH, WORLD, and PARTITION column. This is the default sortorder. |
| L | Changes the displayed length of the DEVICE column. |
Virtual Machine Storage Panel
This panel displays virtual machine-centric storage statistics.
By default, statistics are aggregated on a per-resource-pool basis. One virtual machine has one corresponding resource pool, so the panel displays statistics on a per-virtual-machine basis. You can also view statistics on per-VSCSI-device basis.
Virtual Machine Storage Panel Statistics
| Column | Description |
| ID | Resource pool ID or VSCSI ID of VSCSI device. |
| GID | Resource pool ID. |
| VMNAME | Name of the resource pool. |
| VSCSINAME | Name of the VSCSI device. |
| NDK | Number of VSCSI devices |
| CMDS/s | Number of commands issued per second. |
| READS/s | Number of read commands issued per second. |
| WRITES/s | Number of write commands issued per second. |
| MBREAD/s | Megabytes read per second. |
| MBWRTN/s | Megabytes written per second. |
| LAT/rd | Average latency (in milliseconds) per read. |
| LAT/wr | Average latency (in milliseconds) per write. |
The following table lists the interactive commands you can use with the virtual machine storage panel.
Virtual Machine Storage Panel Interactive Commands
| Command | Description |
| e | Expand or roll up storage VSCSI statistics. Allows you to view storage resource utilization statisticsbroken down by individual VSCSI devices belonging to a group. You are prompted to enter the
group ID. The statistics are per VSCSI device. |
| r | Sort by READS/s column. |
| w | Sort by WRITES/s column. |
| R | Sort by MBREAD/s column. |
| T | Sort by MBWRTN/s column. |
| N | Sort first by VMNAME column, and then by VSCSINAME column. This is the default sort order. |
Network Panel
The Network panel displays server-wide network utilization statistics.
Statistics are arranged by port for each virtual network device configured. For physical network adapter statistics, see the row in the table that corresponds to the port to which the physical network adapter is connected. For statistics on a virtual network adapter configured in a particular virtual machine, see the row corresponding to the port to which the virtual network adapter is connected.
Network Panel Statistics
| Column | Description |
| PORT-ID | Virtual network device port ID. |
| UPLINK | Y means the corresponding port is an uplink. N means it is not. |
| UP | Y means the corresponding link is up. N means it is not. |
| SPEED | Link speed in Megabits per second. |
| FDUPLX | Y means the corresponding link is operating at full duplex. N means it is not. |
| USED-BY | Virtual network device port user. |
| DTYP | Virtual network device type. H means HUB and S means switch. |
| DNAME | Virtual network device name. |
| PKTTX/s | Number of packets transmitted per second. |
| PKTRX/s | Number of packets received per second. |
| MbTX/s | MegaBits transmitted per second. |
| MbRX/s | MegaBits received per second. |
| %DRPTX | Percentage of transmit packets dropped. |
| %DRPRX | Percentage of receive packets dropped. |
| TEAM-PNIC | Name of the physical NIC used for the team uplink. |
| PKTTXMUL/s | Number of multicast packets transmitted per second. |
| PKTRXMUL/s | Number of multicast packets received per second. |
| PKTTXBRD/s | Number of broadcast packets transmitted per second. |
| PKTRXBRD/s | Number of broadcast packets received per second. |
The following table displays the interactive commands you can use with the network panel.
Network Panel Interactive Commands
| Command | Description |
| T | Sorts by Mb Tx column. |
| R | Sorts by Mb Rx column. |
| t | Sorts by Packets Tx column. |
| r | Sorts by Packets Rx column. |
| N | Sorts by PORT-ID column. This is the default sort order. |
| L | Changes the displayed length of the DNAME column. |
Interrupt Panel
The interrupt panel displays information about the use of interrupt vectors.
Interrupt Panel Statistics
| Column | Description |
| VECTOR | Interrupt vector ID. |
| COUNT/s | Total number of interrupts per second. This value is cumulative of the count for every CPU. |
| COUNT_x | Interrupts per second on CPU x. |
| TIME/int | Average processing time per interrupt (in microseconds). |
| TIME_x | Average processing time per interrupt on CPU x (in microseconds). |
| DEVICES | Devices that use the interrupt vector. If the interrupt vector is not enabled for the device, its name isenclosed in angle brackets (< and >). |
Determine use cases for and apply esxtop/resxtop Interactive, Batch and Replay modes
Official Documentation:
vSphere Monitoring and Performance Guide, Chapter 7 “Performance Monitoring Utilities: resxtop and esxtop”, page 59.
See previous objective.
Using Batch Mode
Batch mode allows you to collect and save resource utilization statistics in a file.
After you prepare for batch mode, you can use esxtop or resxtop in this mode.
Prepare for Batch Mode
To run in batch mode, you must first prepare for batch mode.
Procedure
- Run resxtop (or esxtop) in interactive mode.
- In each of the panels, select the columns you want.
- Save this configuration to a file (by default ~/.esxtop50rc) using the W interactive command.
You can now use resxtop (or esxtop) in batch mode.
Use esxtop or resxtop in Batch Mode
After you have prepared for batch mode, you can use esxtop or resxtop in this mode.
Procedure
- Start resxtop (or esxtop) to redirect the output to a file.
For example:
esxtop -b > my_file.csv
The filename must have a .csv extension. The utility does not enforce this, but the post-processing tools require it.
- Process statistics collected in batch mode using tools such as Microsoft Excel and Perfmon.
In batch mode, resxtop (or esxtop) does not accept interactive commands. In batch mode, the utility runs until it produces the number of iterations requested (see command-line option n, below, for more details), or until you end the process by pressing Ctrl+c.
Batch Mode Command-Line Options
You can use batch mode with command-line options.
Command-Line Options in Batch Mode
| Option | Description |
| a | Show all statistics. This option overrides configuration file setups and shows all statistics. Theconfiguration file can be the default ~/.esxtop50rc configuration file or a user-defined
configuration file. |
| b | Runs resxtop (or esxtop) in batch mode. |
| c filename | Load a user-defined configuration file. If the -c option is not used, the default configurationfilename is ~/.esxtop41rc. Create your own configuration file, specifying a different filename, using
the W single-key interactive command. |
| d | Specifies the delay between statistics snapshots. The default is five seconds. The minimum is twoseconds. If a delay of less than two seconds is specified, the delay is set to two seconds. |
| n | Number of iterations. resxtop (or esxtop) collects and saves statistics this number of times, andthen exits. |
| server | The name of the remote server host to connect to (required, resxtop only). |
| vihost | If you connect indirectly (through vCenter Server), this option should contain the name of theESXi host you connect to. If you connect directly to the ESXi host, this option is not used. Note that
the host name needs to be the same as what appears in the vSphere Client. |
| portnumber | The port number to connect to on the remote server. The default port is 443, and unless this ischanged on the server, this option is not needed. (resxtop only) |
| username | The user name to be authenticated when connecting to the remote host. You are prompted by theremote server for a password, as well (resxtop only). |
Using Replay Mode
In replay mode, esxtop replays resource utilization statistics collected using vm-support.
After you prepare for replay mode, you can use esxtop in this mode. See the vm-support man page.
In replay mode, esxtop accepts the same set of interactive commands as in interactive mode and runs until no more snapshots are collected by vm-support to be read or until the requested number of iterations are completed.
Prepare for Replay Mode
To run in replay mode, you must prepare for replay mode.
Procedure
- Run vm-support in snapshot mode in the ESXi Shell.
Use the following command.
vm-support -S -d duration -I interval
- Unzip and untar the resulting tar file so that esxtop can use it in replay mode.
You can now use esxtop in replay mode.
Use esxtop in Replay Mode
You can use esxtop in replay mode.
Replay mode can be run to produce output in the same style as batch mode (see the command-line option b, below).
NOTE Batch output from esxtop cannot be played back by resxtop.
Snapshots collected by vm-supported can be replayed by esxtop. However, vm-support output generated by ESXi can be replayed only by esxtop running on the same version of ESXi.
Procedure
- To activate replay mode, enter the following at the command-line prompt.
esxtop -R vm-support_dir_path
Replay Mode Command-Line Options
You can use replay mode with command-line options.
The following table lists the command-line options available for esxtop replay mode.
Command-Line Options in Replay Mode
| Option | Description |
| R | Path to the vm-support collected snapshot’s directory. |
| a | Show all statistics. This option overrides configuration file setups and shows all statistics. Theconfiguration file can be the default ~/.esxtop50rc configuration file or a user-defined
configuration file. |
| B | Runs esxtop in Batch mode. |
| c filename | Load a user-defined configuration file. If the -c option is not used, the default configurationfilename is ~/.esxtop50rc. Create your own configuration file and specify a different filename
using the W single-key interactive command. |
| d | Specifies the delay between panel updates. The default is five seconds. The minimum is twoseconds. If a delay of less than two seconds is specified, the delay is set to two seconds. |
| N | Number of iterations esxtop updates the display this number of times and then exits. |
Use vscsiStats to gather storage performance data
Official Documentation:
“Using vscsiStats for Storage Performance Analysis“, from the VMware Communities seems to be the official documentation on this subject. Unofficial are a lot of excellent Blog posts. I will mention a few in the “Other references” section.
esxtop is a great tool for performance analysis of all types. However, with only latency and throughput statistics, esxtop will not provide the full picture of the storage profile. Furthermore, esxtop only provides latency numbers for Fibre Channel and iSCSI storage. Latency analysis of NFS traffic is not possible with esxtop.
Since ESX 3.5, VMware has provided a tool specifically for profiling storage: vscsiStats. vscsiStats collects and reports counters on storage activity. Its data is collected at the virtual SCSI device level in the kernel. This means that results are reported per VMDK (or RDM) irrespective of the underlying storage protocol. The following data are reported in histogram form:
- IO size
- Seek distance
- Outstanding IOs
- Latency (in microseconds)
- More!
Running vscsiStats
vscsiStats collection and analysis requires two steps:
- Start statistics collection.
- View accrued statistics.
Documentation on command-line parameters are available when running ‘/usr/lib/vmware/bin/vscsiStats -h’.
Starting and Stopping vscsiStats Collection
The tool is started with the following command:
/usr/lib/vmware/bin/vscsiStats -s -w <world_group_id>
This command starts the process that will accrue statistics. The world group ID must be set to a running virtual machine. The running VMs’ IDs can be obtained by running ‘/usr/lib/vmware/bin/vscsiStats -l’.
After about 30 minutes vscsiStats will stop running. If the analysis is needed for a longer period, the start command should be repeated above in this window. That will defer the timeout and termination by another 30 minutes.
Since results are accrued and reported out in summary, the histograms will include data since collection was started. To reset all counters to zero, run ‘/usr/lib/vmware/bin/vscsiStats -r’.
Viewing Statistics
Counters are displayed by using the following command:
/usr/lib/vmware/bin/vscsiStats -p <histo_type> [-c]
The histogram type is used to specify either all of the statistics or one group of them. Options include all, ioLength, seekDistance, outstandingIOs, latency, interarrival.
Results can be produced in a more compact comma-delimited list by adding the optional “-c” above.
Using vscsiStats Results
Use Case 1: Identifying Sequential IO
Storage arrays can process sequential IO much faster than random IO. You can therefore improve the performance of a sequential workload by placing it on a dedicated LUN to allow the array to optimize access. vscsiStats can help you identify your sequential workloads even if you don’t understand anything about the application in the VM.
Take the following graph as example, which I generated by running ‘/usr/lib/vmware/bin/vscsiStats -p seekDistance’:
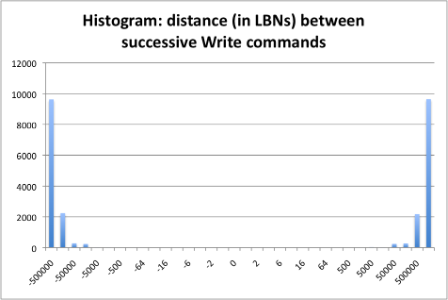
This graph shows that most of the commands are being issued a great distance from the previous command. It looks like all of the commands were 50,000 or more logical blocks away from the previous command. When I looked at the raw data, I saw that over 99% of the commands were more than 128 blocks away from the previous command. That’s random access if I’ve ever seen it. Here’s the opposite example:
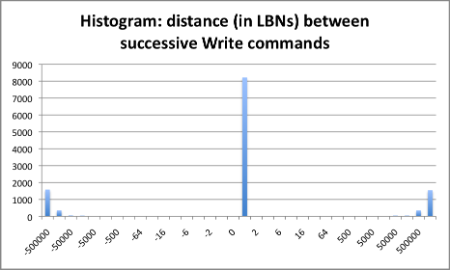
In this case the logical block number (LBN) of each command is most frequently exactly one larger than the previous command. That’s the signature of a heavily sequential workload. It shouldn’t surprise you to learn that both of these profiles were generated by Iometer using random and sequential writes, respectively.
Use Case 2: Optimizing for IO Sizes
The IO size is an important characteristic of storage profiles. A variety of best practices have been provided by storage vendors to enable customers to tune their storage to a particular IO size. As an example, it may make sense to optimize an array’s stripe size to its average IO size. vscsiStats can provide a histogram of IO sizes to help this process. The following graph was generated by ‘/usr/lib/vmware/bin/vscsiStats -p ioLength’:

From these results I can see that about a quarter of the commands came in IOs smaller than 4k. About half of the commands were sized to 4k commands. The minute number of remaining IOs were larger than 4k. This signature is common of a VMDK formatted to 4k blocks and supporting OS and application execution. The storage array should be optimized for 4k blocks if this disk’s performance is a priority.
Use Case 3: Storage Latency Analysis (Including NFS!)
esxtop is a terrific tool for latency-based storage analysis. Fibre Channel and iSCSI HBAs have device and kernel latencies in esxtop’s storage panel. Software iSCSI initiators will show up as vmhba32 (ESX 3.5 and earlier) and vmhba33 (ESX 4.0 and later.) But esxtop does not provide latency statistics for NFS stores.
Because vscsiStats collects its results where the guest interacts with the hypervisor, it is unaware of the storage implementation. Latency statistics can be collected for all storage configurations with this tool.
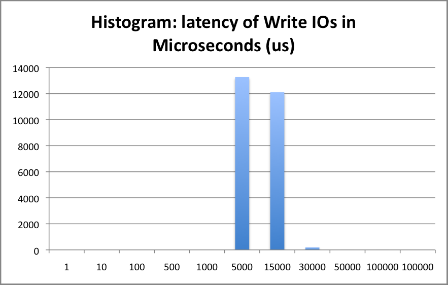
The above graph shows that the server in my office with a single direct-attached SCSI disk is performing as I would expect. About half of all the operations are completing in under 5 ms. The other half take 5-15 ms to complete. A few commands took longer than 15 ms, but the number is so small that it doesn’t concern me. Similar results can be seen with NFS arrays.
vscsiStats on ESXi
vscsiStats can be installed on ESXi hosts after putting the host into tech support mode. More information on this process is availalble on Scott’s blog on the subject on vPivot.
More information
- Gabe’s Virtual World: http://www.gabesvirtualworld.com/using-vscsistats-the-full-how-to/
- Duncan Epping Blog Yellow Bricks: http://www.yellow-bricks.com/2009/12/17/vscsistats/
Use esxtop/resxtop to collect performance data
Official Documentation:
vSphere Monitoring and Performance Guide, Chapter 7 “Performance Monitoring Utilities: resxtop and esxtop”, page 45.
See previous objectives.
More information
- Duncan Epping Blog Yellow Bricks: http://www.yellow-bricks.com/esxtop/
Given esxtop/resxtop output, identify relative performance data for capacity planning purposes
Official Documentation:
None.
More information
- You want to know more about the various statistics and how to interpret these? Read VMware Communities “Interpreting esxtop Statistics”
- Now you know everything about the statisctics, but what are the thresholds? Read this excellent post on esxtop by Duncan Epping.
- A recent nice example by Duncan Epping “Why is %WAIT so high in esxtop?”
- VMware KB 1017926 “Troubleshooting a virtual machine that has stopped responding: VMM and Guest CPU usage comparison”
Other exam notes
- The Saffageek VCAP5-DCA Objectives http://thesaffageek.co.uk/vcap5-dca-objectives/
- Paul Grevink The VCAP5-DCA diaries http://paulgrevink.wordpress.com/the-vcap5-dca-diaries/
- Edward Grigson VCAP5-DCA notes http://www.vexperienced.co.uk/vcap5-dca/
- Jason Langer VCAP5-DCA notes http://www.virtuallanger.com/vcap-dca-5/
- The Foglite VCAP5-DCA notes http://thefoglite.com/vcap-dca5-objective/
VMware vSphere official documentation
| VMware vSphere Basics Guide | html | epub | mobi | |
| vSphere Installation and Setup Guide | html | epub | mobi | |
| vSphere Upgrade Guide | html | epub | mobi | |
| vCenter Server and Host Management Guide | html | epub | mobi | |
| vSphere Virtual Machine Administration Guide | html | epub | mobi | |
| vSphere Host Profiles Guide | html | epub | mobi | |
| vSphere Networking Guide | html | epub | mobi | |
| vSphere Storage Guide | html | epub | mobi | |
| vSphere Security Guide | html | epub | mobi | |
| vSphere Resource Management Guide | html | epub | mobi | |
| vSphere Availability Guide | html | epub | mobi | |
| vSphere Monitoring and Performance Guide | html | epub | mobi | |
| vSphere Troubleshooting | html | epub | mobi | |
| VMware vSphere Examples and Scenarios Guide | html | epub | mobi |
Disclaimer.
The information in this article is provided “AS IS” with no warranties, and confers no rights. This article does not represent the thoughts, intentions, plans or strategies of my employer. It is solely my opinion.